Introduction
E-commerce generates massive amounts of data every day. As a data analyst, you'll be asked questions
like "What are our top-selling products?", "Which customers are most valuable?", and "How did sales
perform this month?". This guide teaches you the SQL queries to answer these real business
questions.
Why E-commerce SQL Matters
E-commerce companies are among the largest employers of data analysts. Amazon, Flipkart, Myntra,
and countless other companies rely on SQL-based analysis for daily decision-making. Master these
queries and you'll be job-ready.
Before diving into queries, let's understand the typical e-commerce database structure we'll be
working with:
CREATE TABLE customers (
customer_id INT PRIMARY KEY,
customer_name VARCHAR(100),
email VARCHAR(100),
city VARCHAR(50),
state VARCHAR(50),
registration_date DATE
);
CREATE TABLE products (
product_id INT PRIMARY KEY,
product_name VARCHAR(200),
category VARCHAR(50),
price DECIMAL(10,2),
cost DECIMAL(10,2)
);
CREATE TABLE orders (
order_id INT PRIMARY KEY,
customer_id INT,
order_date DATE,
status VARCHAR(20),
shipping_cost DECIMAL(10,2)
);
CREATE TABLE order_items (
item_id INT PRIMARY KEY,
order_id INT,
product_id INT,
quantity INT,
unit_price DECIMAL(10,2),
discount DECIMAL(5,2)
);
Table Relationships
- customers 1:N orders (one customer, many orders)
- orders 1:N order_items (one order, many items)
- products 1:N order_items (one product in many orders)
Query 1: Total Revenue
The most fundamental metric - how much money did we make?
SELECT
SUM(oi.quantity * oi.unit_price * (1 -
COALESCE(oi.discount, 0))) AS total_revenue
FROM order_items oi
JOIN orders o ON oi.order_id =
o.order_id
WHERE o.status = 'Completed';
Query 2: Monthly Sales Report
SELECT
DATE_FORMAT(o.order_date, '%Y-%m')
AS month,
COUNT(DISTINCT o.order_id) AS total_orders,
SUM(oi.quantity * oi.unit_price) AS
gross_revenue,
ROUND(SUM(oi.quantity *
oi.unit_price) / COUNT(DISTINCT
o.order_id), 2) AS avg_order_value
FROM orders o
JOIN order_items oi ON o.order_id =
oi.order_id
WHERE o.status = 'Completed'
GROUP BY DATE_FORMAT(o.order_date,
'%Y-%m')
ORDER BY month DESC;
Query 3: Sales by Region
SELECT
c.state,
COUNT(DISTINCT o.order_id) AS total_orders,
COUNT(DISTINCT c.customer_id) AS unique_customers,
SUM(oi.quantity * oi.unit_price) AS
revenue,
ROUND(SUM(oi.quantity *
oi.unit_price) / COUNT(DISTINCT
c.customer_id), 2) AS
revenue_per_customer
FROM customers c
JOIN orders o ON c.customer_id =
o.customer_id
JOIN order_items oi ON o.order_id =
oi.order_id
WHERE o.status = 'Completed'
GROUP BY c.state
ORDER BY revenue DESC
LIMIT 10;
Business Insight
This query helps identify your best-performing regions. Focus marketing efforts on
high-revenue states, and investigate why some states underperform.
Query 4: Customer Lifetime Value (CLV)
SELECT
c.customer_id,
c.customer_name,
c.email,
COUNT(DISTINCT o.order_id) AS total_orders,
SUM(oi.quantity * oi.unit_price) AS
lifetime_value,
MIN(o.order_date) AS first_order,
MAX(o.order_date) AS last_order,
DATEDIFF(CURDATE(), MAX(o.order_date)) AS
days_since_last_order
FROM customers c
JOIN orders o ON c.customer_id =
o.customer_id
JOIN order_items oi ON o.order_id =
oi.order_id
WHERE o.status = 'Completed'
GROUP BY c.customer_id, c.customer_name, c.email
ORDER BY lifetime_value DESC
LIMIT 20;
Query 5: RFM Segmentation
RFM (Recency, Frequency, Monetary) is a powerful customer segmentation technique:
WITH customer_rfm AS (
SELECT
c.customer_id,
c.customer_name,
DATEDIFF(CURDATE(), MAX(o.order_date)) AS recency,
COUNT(DISTINCT o.order_id) AS frequency,
SUM(oi.quantity * oi.unit_price) AS
monetary
FROM customers c
JOIN orders o ON c.customer_id =
o.customer_id
JOIN order_items oi ON o.order_id =
oi.order_id
WHERE o.status = 'Completed'
GROUP BY c.customer_id, c.customer_name
)
SELECT
customer_id,
customer_name,
recency,
frequency,
monetary,
CASE
WHEN recency <= 30 AND frequency >= 5 AND monetary >= 10000 THEN 'Champions'
WHEN recency <= 60 AND frequency >= 3 THEN 'Loyal Customers'
WHEN recency <= 30 AND frequency = 1 THEN 'New Customers'
WHEN recency > 90 AND frequency >= 3 THEN 'At Risk'
WHEN recency > 180 THEN 'Lost'
ELSE 'Regular'
END AS customer_segment
FROM customer_rfm
ORDER BY monetary DESC;
Visualizing Customer Segments based on RFM Scores.
| Segment |
Criteria |
Action |
| Champions |
Recent, frequent, high spenders |
Reward with exclusive offers |
| Loyal Customers |
Regular purchasers |
Upsell premium products |
| At Risk |
Haven't purchased recently |
Re-engagement campaigns |
| Lost |
Long time since last purchase |
Win-back offers |
Query 6: New vs Returning Customers
WITH first_orders AS (
SELECT
customer_id,
MIN(order_date) AS first_order_date
FROM orders
WHERE status = 'Completed'
GROUP BY customer_id
)
SELECT
DATE_FORMAT(o.order_date, '%Y-%m')
AS month,
COUNT(DISTINCT CASE
WHEN DATE_FORMAT(o.order_date, '%Y-%m') = DATE_FORMAT(fo.first_order_date, '%Y-%m')
THEN o.customer_id
END) AS new_customers,
COUNT(DISTINCT CASE
WHEN DATE_FORMAT(o.order_date, '%Y-%m') != DATE_FORMAT(fo.first_order_date, '%Y-%m')
THEN o.customer_id
END) AS returning_customers
FROM orders o
JOIN first_orders fo ON o.customer_id
= fo.customer_id
WHERE o.status = 'Completed'
GROUP BY DATE_FORMAT(o.order_date,
'%Y-%m')
ORDER BY month DESC;
Query 7: Top Selling Products
SELECT
p.product_id,
p.product_name,
p.category,
SUM(oi.quantity) AS units_sold,
SUM(oi.quantity * oi.unit_price) AS
revenue,
SUM(oi.quantity * (oi.unit_price - p.cost)) AS profit,
ROUND(SUM(oi.quantity *
(oi.unit_price - p.cost)) /
SUM(oi.quantity * oi.unit_price) * 100, 2) AS
profit_margin_pct
FROM products p
JOIN order_items oi ON p.product_id =
oi.product_id
JOIN orders o ON oi.order_id =
o.order_id
WHERE o.status = 'Completed'
GROUP BY p.product_id, p.product_name, p.category
ORDER BY revenue DESC
LIMIT 20;
Query 8: Category Performance
SELECT
p.category,
COUNT(DISTINCT p.product_id) AS products_count,
SUM(oi.quantity) AS units_sold,
SUM(oi.quantity * oi.unit_price) AS
revenue,
ROUND(AVG(oi.unit_price), 2) AS avg_selling_price,
ROUND(SUM(oi.quantity *
oi.unit_price) * 100.0 /
SUM(SUM(oi.quantity *
oi.unit_price)) OVER(), 2) AS revenue_share_pct
FROM products p
JOIN order_items oi ON p.product_id =
oi.product_id
JOIN orders o ON oi.order_id =
o.order_id
WHERE o.status = 'Completed'
GROUP BY p.category
ORDER BY revenue DESC;
Query 9: Products Frequently Bought Together
SELECT
p1.product_name AS product_1,
p2.product_name AS product_2,
COUNT(*) AS times_bought_together
FROM order_items oi1
JOIN order_items oi2 ON oi1.order_id =
oi2.order_id
AND oi1.product_id < oi2.product_id
JOIN products p1 ON oi1.product_id = p1.product_id
JOIN products p2 ON oi2.product_id
= p2.product_id
GROUP BY p1.product_name, p2.product_name
HAVING COUNT(*) >= 10
ORDER BY times_bought_together DESC
LIMIT 20;
Business Application
Use this query to create product bundles, "Frequently Bought Together" recommendations, and
cross-selling strategies.
Query 10: Year-over-Year Growth
WITH monthly_sales AS (
SELECT
YEAR(o.order_date) AS year,
MONTH(o.order_date) AS month,
SUM(oi.quantity * oi.unit_price) AS
revenue
FROM orders o
JOIN order_items oi ON o.order_id =
oi.order_id
WHERE o.status = 'Completed'
GROUP BY YEAR(o.order_date), MONTH(o.order_date)
)
SELECT
curr.month,
curr.revenue AS current_year_revenue,
prev.revenue AS previous_year_revenue,
ROUND((curr.revenue - prev.revenue) / prev.revenue * 100, 2) AS
yoy_growth_pct
FROM monthly_sales curr
LEFT JOIN monthly_sales prev
ON curr.month = prev.month
AND curr.year = prev.year + 1
WHERE curr.year = YEAR(CURDATE())
ORDER BY curr.month;
Query 11: Day of Week Analysis
SELECT
DAYNAME(o.order_date) AS day_of_week,
COUNT(DISTINCT o.order_id) AS total_orders,
SUM(oi.quantity * oi.unit_price) AS
revenue,
ROUND(AVG(oi.quantity *
oi.unit_price), 2) AS avg_order_value
FROM orders o
JOIN order_items oi ON o.order_id =
oi.order_id
WHERE o.status = 'Completed'
GROUP BY DAYNAME(o.order_date), DAYOFWEEK(o.order_date)
ORDER BY DAYOFWEEK(o.order_date);
Query 12: Running Total (Cumulative Sales)
SELECT
order_date,
daily_revenue,
SUM(daily_revenue) OVER (ORDER BY order_date) AS
cumulative_revenue
FROM (
SELECT
o.order_date,
SUM(oi.quantity * oi.unit_price) AS
daily_revenue
FROM orders o
JOIN order_items oi ON o.order_id =
oi.order_id
WHERE o.status = 'Completed'
AND YEAR(o.order_date) = YEAR(CURDATE())
GROUP BY o.order_date
) daily_sales
ORDER BY order_date;
Query 13: Customer Retention Rate
WITH cohorts AS (
SELECT
customer_id,
DATE_FORMAT(MIN(order_date), '%Y-%m-01') AS cohort_month
FROM orders
WHERE status = 'Completed'
GROUP BY customer_id
),
activities AS (
SELECT
o.customer_id,
c.cohort_month,
TIMESTAMPDIFF(MONTH, c.cohort_month,
o.order_date) AS month_number
FROM orders o
JOIN cohorts c ON o.customer_id =
c.customer_id
WHERE o.status = 'Completed'
)
SELECT
cohort_month,
COUNT(DISTINCT CASE WHEN month_number = 0 THEN customer_id END) AS month_0,
COUNT(DISTINCT CASE WHEN month_number = 1 THEN customer_id END) AS month_1,
COUNT(DISTINCT CASE WHEN month_number = 2 THEN customer_id END) AS month_2,
COUNT(DISTINCT CASE WHEN month_number = 3 THEN customer_id END) AS month_3
FROM activities
GROUP BY cohort_month
ORDER BY cohort_month;
Query 14: Order Funnel Analysis
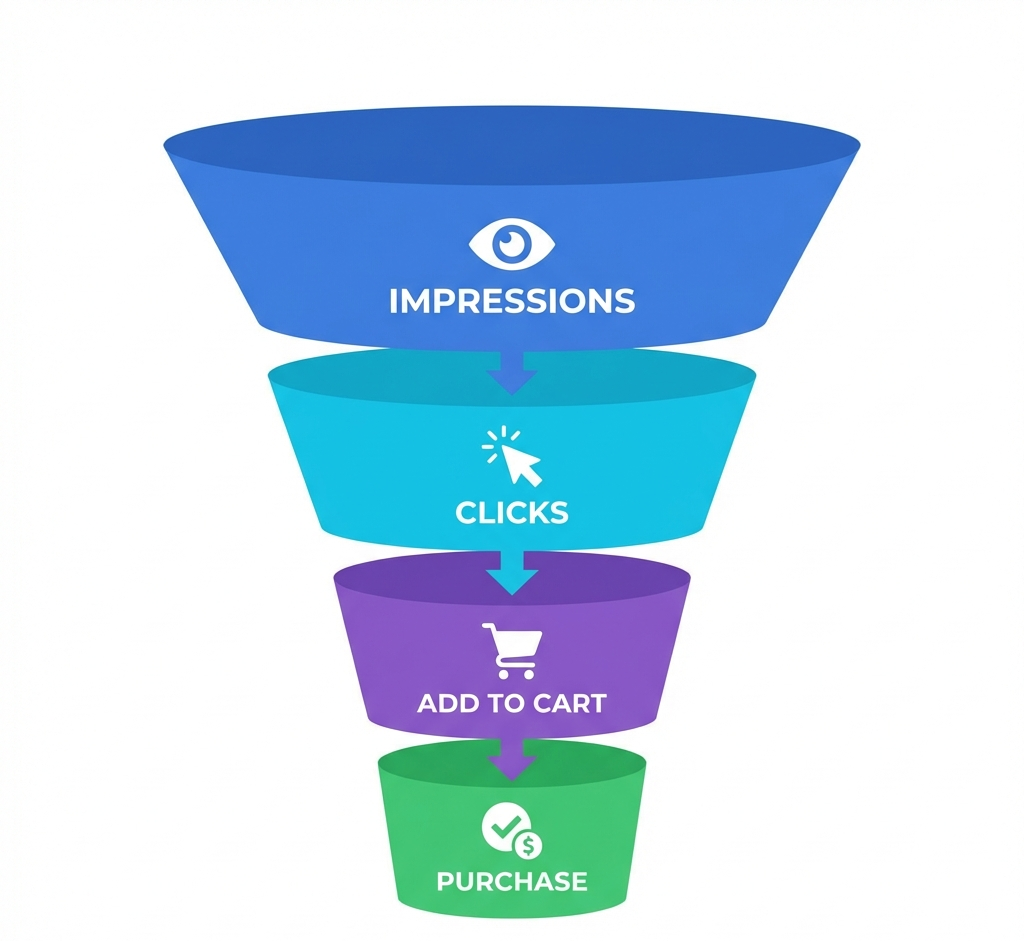
The Conversion Funnel: From Visitor to Customer.
SELECT
DATE_FORMAT(order_date, '%Y-%m') AS month,
COUNT(*) AS total_orders,
SUM(CASE WHEN status = 'Completed' THEN 1 ELSE
0 END) AS
completed,
SUM(CASE WHEN status = 'Cancelled' THEN 1 ELSE
0 END) AS
cancelled,
SUM(CASE WHEN status = 'Returned' THEN 1 ELSE
0 END) AS
returned,
ROUND(SUM(CASE WHEN status = 'Completed' THEN 1 ELSE 0
END) * 100.0 / COUNT(*), 2) AS completion_rate
FROM orders
GROUP BY DATE_FORMAT(order_date,
'%Y-%m')
ORDER BY month DESC;
Query 15: Executive Dashboard Summary
SELECT
(SELECT SUM(oi.quantity *
oi.unit_price)
FROM order_items oi
JOIN orders o ON oi.order_id =
o.order_id
WHERE o.status = 'Completed'
AND MONTH(o.order_date) = MONTH(CURDATE())
AND YEAR(o.order_date) = YEAR(CURDATE())) AS mtd_revenue,
(SELECT COUNT(DISTINCT order_id)
FROM orders
WHERE status = 'Completed'
AND MONTH(order_date) = MONTH(CURDATE())
AND YEAR(order_date) = YEAR(CURDATE())) AS mtd_orders,
(SELECT COUNT(DISTINCT customer_id)
FROM orders
WHERE status = 'Completed'
AND MONTH(order_date) = MONTH(CURDATE())
AND YEAR(order_date) = YEAR(CURDATE())) AS mtd_customers,
(SELECT COUNT(*)
FROM customers
WHERE MONTH(registration_date) =
MONTH(CURDATE())
AND YEAR(registration_date) = YEAR(CURDATE())) AS new_registrations;
Key Queries Summary
- Sales: Total revenue, monthly trends, regional breakdown
- Customers: CLV, RFM segmentation, new vs returning
- Products: Top sellers, category performance, market basket
- Trends: YoY growth, day-of-week patterns, running totals
- Advanced: Cohort retention, funnel analysis, dashboards
Practice These Queries
Download sample e-commerce datasets from Kaggle or use MySQL's sample sakila database to practice
these queries. The best way to learn SQL is by doing!
Learn E-commerce Analytics with EDUSHARK TRAINING
Our Data Analytics program includes hands-on projects with real e-commerce datasets.
You'll build dashboards, write complex queries, and present insights to stakeholders.
View Our Data Analytics Program